Some Analysis of Ishikawa Earthquakes
2024-01-03There are still a number of afterschocks (current time is almost 9am, January 3rd). But, are the aftershocks keeping at the same pace?
Continuing the code from a previous post and using the same quakes dataframe, I first filter by time (everything since 4pm on January 1) and the location (Ishikawa prefecture, code 390).
# make a datetime mask
start = datetime.datetime.fromisoformat("2024-01-01 16:00") # 4pm, new years
dt_mask = (quakes.date_time > start)

# make a location mask
location_mask = quakes.area_code == 390

# filter the dataframe and make a copy (so we're not dealing with a dataframe slice later)
iquakes = quakes[location_mask & dt_mask].copy()

# Then make a few more columns - just day and hour will be enough
iquakes["date"] = iquakes.date_time.dt.date
iquakes["hour"] = iquakes.date_time.dt.hour

# We'll also get the total number
total_quakes = iquakes.shape[0]
iquakes.groupby(["date", "hour"]).date_time.count().plot(
    kind="bar",
    title=f"Number of Earthquakes per hour in Ishikawa (202401011600-202401030900); Total: {total_quakes}",
    figsize=(15,8),
    grid=True,
    ylabel="Count"
)
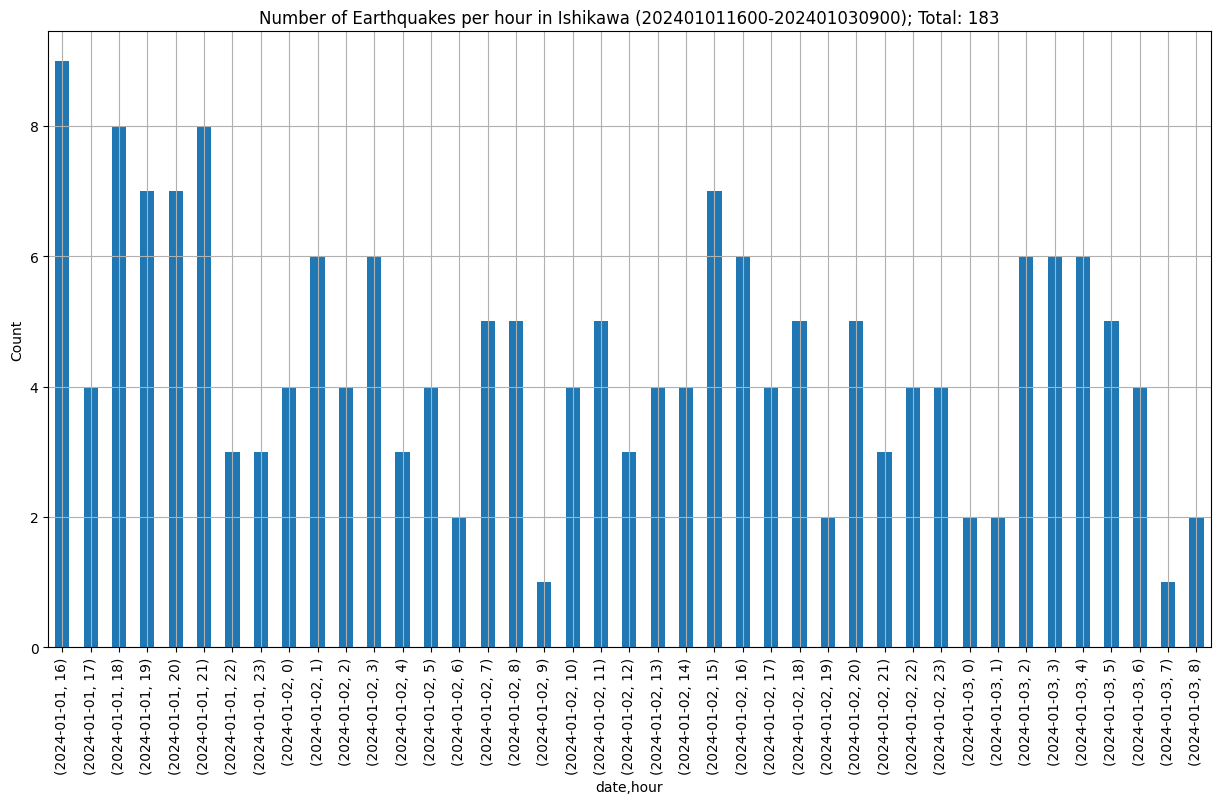
It looks like there were quite a few quakes last night between 2-5am.
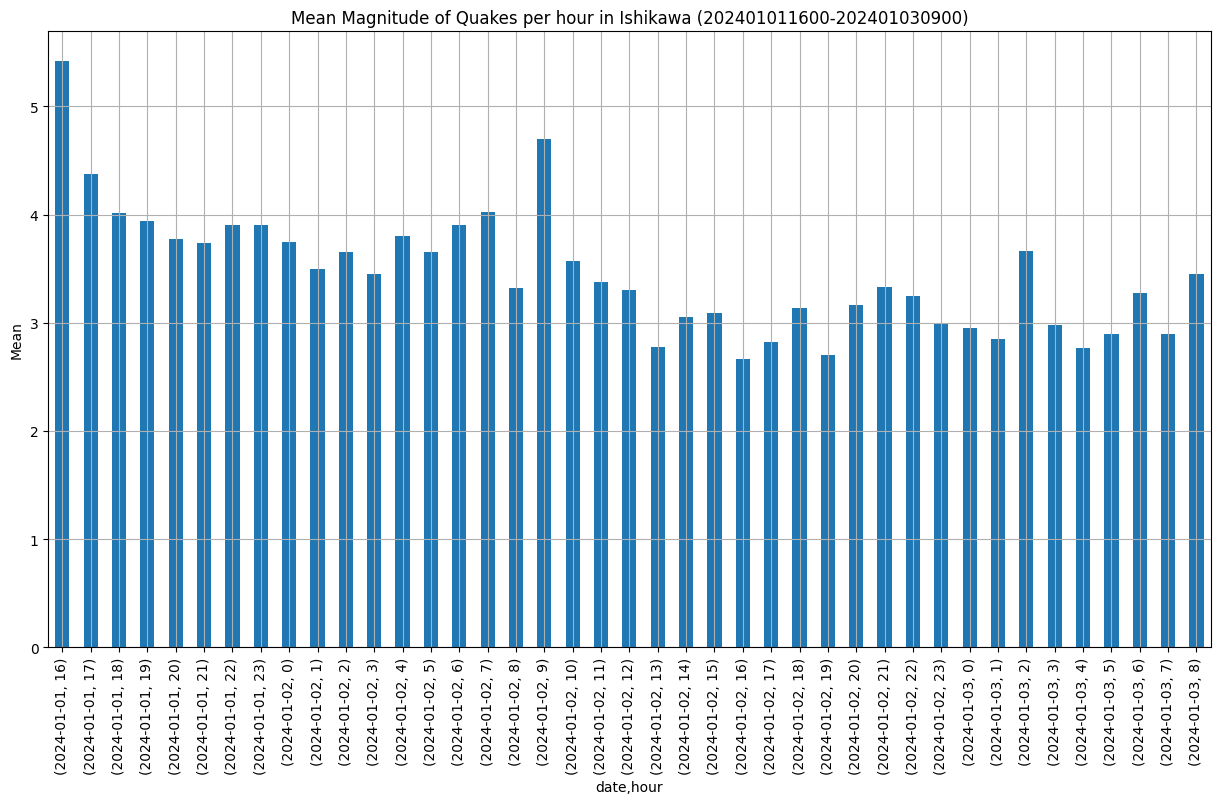
Using the same grouping idea, this time lets see the average magnitude per hour.
iquakes.groupby(["date", "hour"]).mag.mean().plot(
    kind="bar",
    title=f"Mean Magnitude of Quakes per hour in Ishikawa (202401011600-202401030900)",
    figsize=(15,8),
    grid=True,
    ylabel="Mean"
)
But, the actual intensity is important as well. This is a measurement used in Japan that gives people a good idea of how intense the earthquake was. The scale ranges from 1 to 7, 7 being the worst. But it has a few other things like 5 Lower, 5 Upper, 6 Lower, 6 Upper. So really in total there are 9 possible values.
This kind of information gives you a better idea of what kind of impact a quake may have.
The data can be grouped by the intensity and from there it’s trivial to get descriptive statistics:
intensity_index = ["1","2","3","4","5-","5+","6-","6+","7"]
iquakes.groupby("max_intensity").mag.describe().reindex(intensity_index)
| count | mean | std | min | 25% | 50% | 75% | max | |
|---|---|---|---|---|---|---|---|---|
| max_intensity | ||||||||
| 1 | 56.0 | 2.837500 | 0.385917 | 1.9 | 2.575 | 2.9 | 3.025 | 3.6 |
| 2 | 59.0 | 3.359322 | 0.449566 | 2.4 | 3.100 | 3.3 | 3.700 | 4.3 |
| 3 | 44.0 | 3.822727 | 0.447662 | 2.8 | 3.575 | 3.8 | 4.200 | 4.8 |
| 4 | 17.0 | 4.547059 | 0.291800 | 4.0 | 4.400 | 4.5 | 4.700 | 5.2 |
| 5- | 2.0 | 5.100000 | 0.707107 | 4.6 | 4.850 | 5.1 | 5.350 | 5.6 |
| 5+ | 4.0 | 5.625000 | 0.457347 | 5.0 | 5.525 | 5.7 | 5.800 | 6.1 |
| 6- | NaN | NaN | NaN | NaN | NaN | NaN | NaN | NaN |
| 6+ | NaN | NaN | NaN | NaN | NaN | NaN | NaN | NaN |
| 7 | 1.0 | 7.600000 | NaN | 7.6 | 7.600 | 7.6 | 7.600 | 7.6 |
You will notice that there is no 6- or 6+. Those intensities did occur but they were at the same time as the M7.6 quake - and this is showing the maximum intensity per quake, and for that one it was 7. In other words, there were no quakes that had a maximum intensity of 6- or 6+, at least within the last few days.
A few other interesting things to note:
- There are slightly more quakes that result in a level 2 intensity
- Quakes that could potentially result in damage (
5+or greater intensity) are not many – 6 in total. - There were 4 quakes that resulted in 5 Upper intensity - depending on where those occured, that could have caused further damage to already broken houses.
Probably a particularly useful and informative data point would now require loading all of the attached JSON files, flattening the data, and getting the maximum intensity for each city or station. Then it would be possible to see which cities may have been affected the worst. Those cities need aid.
That makes me wonder if agencies are using that kind of aggregated information or are strictly relying on other data like phone-ins, etc.