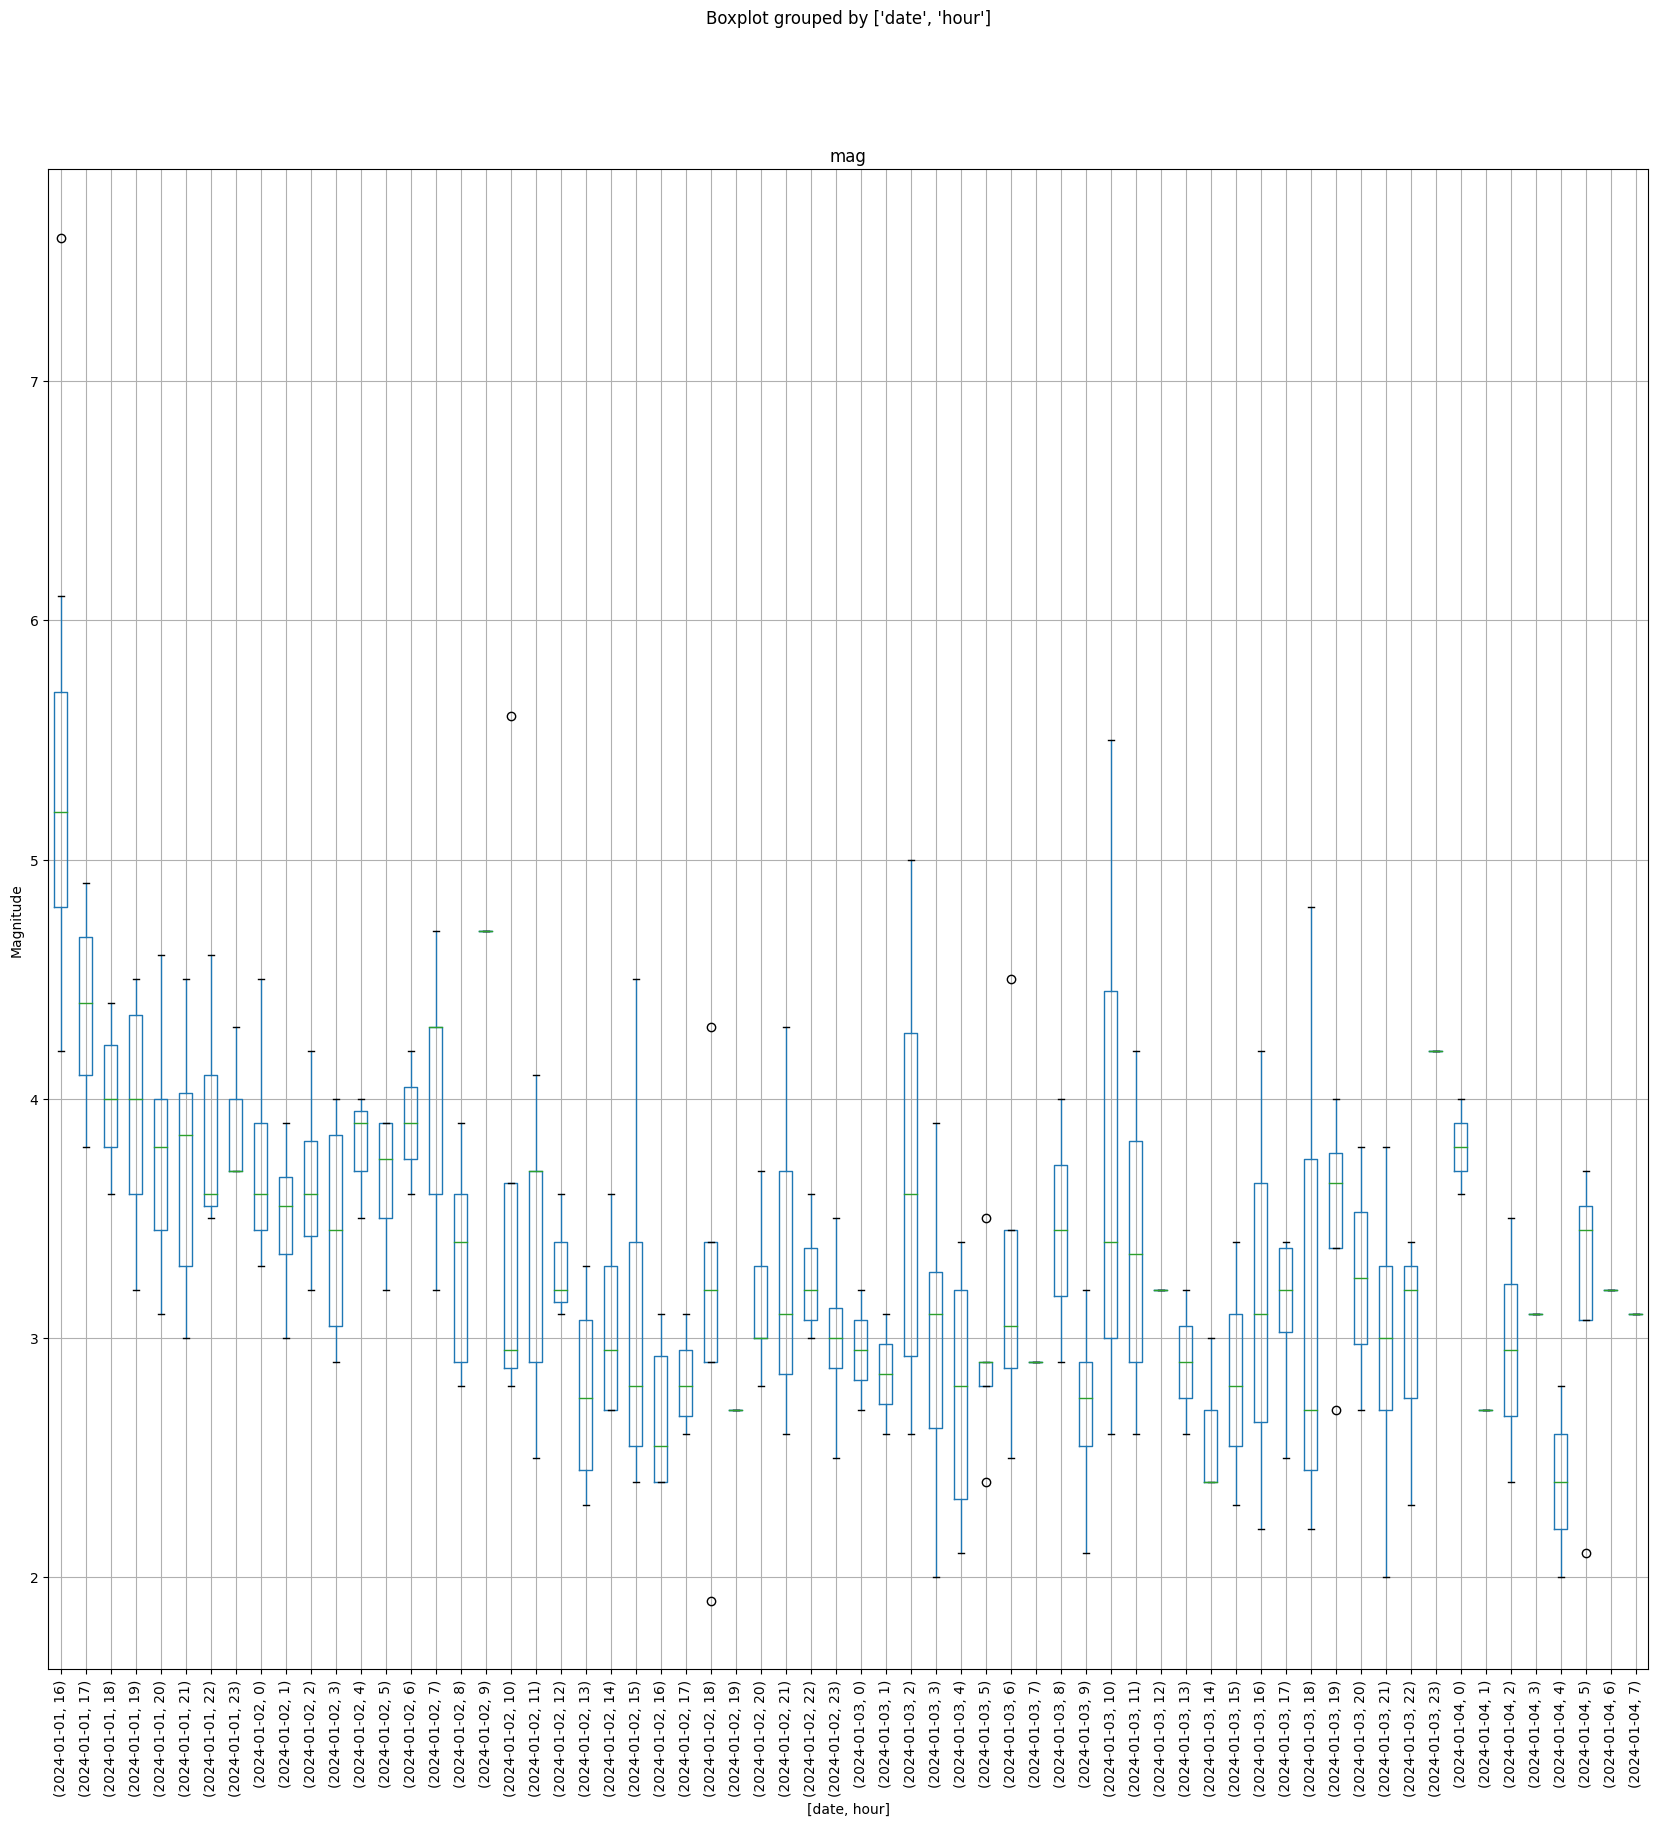
Ishikawa Quakes boxplot
2024-01-04iquakes.shape[0]
247
A quick post. It’s almost 8:30am, January 4th. There have been 247 quakes since the big one.
Let’s see what the magnitude is like as a boxplot (for every hour):
iquakes.boxplot(
    by=["date", "hour"],
    column=["mag"],
    rot=90,
    figsize=(20,20),
    ylabel="Magnitude",
)
