2024-01-03
There are still a number of afterschocks (current time is almost 9am, January 3rd). But, are the aftershocks keeping at the same pace?
Continuing the code from a previous post and using the same quakes dataframe, I first filter by time (everything since 4pm on January 1) and the location (Ishikawa prefecture, code 390).
# make a datetime mask
start = datetime.datetime.fromisoformat("2024-01-01 16:00") # 4pm, new years
dt_mask = (quakes.date_time > start)

# make a location mask
location_mask = quakes.area_code == 390

# filter the dataframe and make a copy (so we're not dealing with a dataframe slice later)
iquakes = quakes[location_mask & dt_mask].copy()

# Then make a few more columns - just day and hour will be enough
iquakes["date"] = iquakes.date_time.dt.date
iquakes["hour"] = iquakes.date_time.dt.hour

# We'll also get the total number
total_quakes = iquakes.shape[0]
iquakes.groupby(["date", "hour"]).date_time.count().plot(
    kind="bar",
    title=f"Number of Earthquakes per hour in Ishikawa (202401011600-202401030900); Total: {total_quakes}",
    figsize=(15,8),
    grid=True,
    ylabel="Count"
)
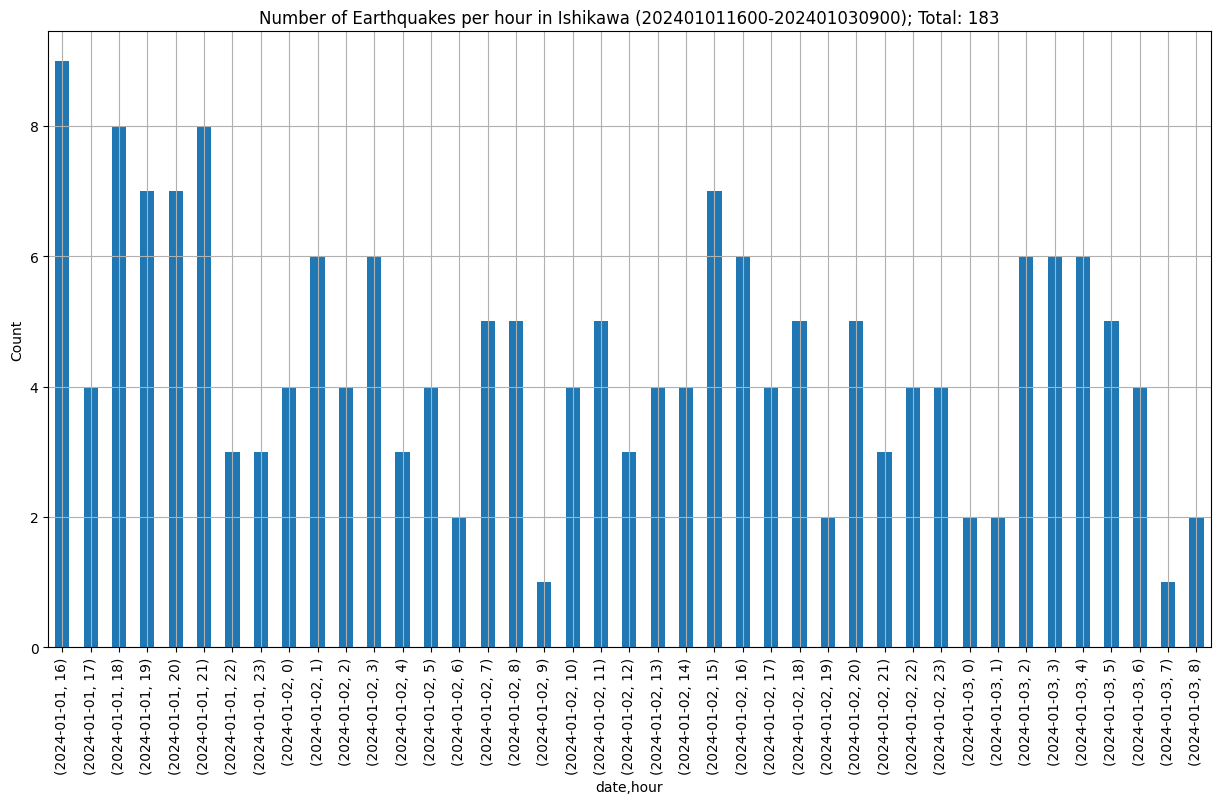
It looks like there were quite a few quakes last night between 2-5am.
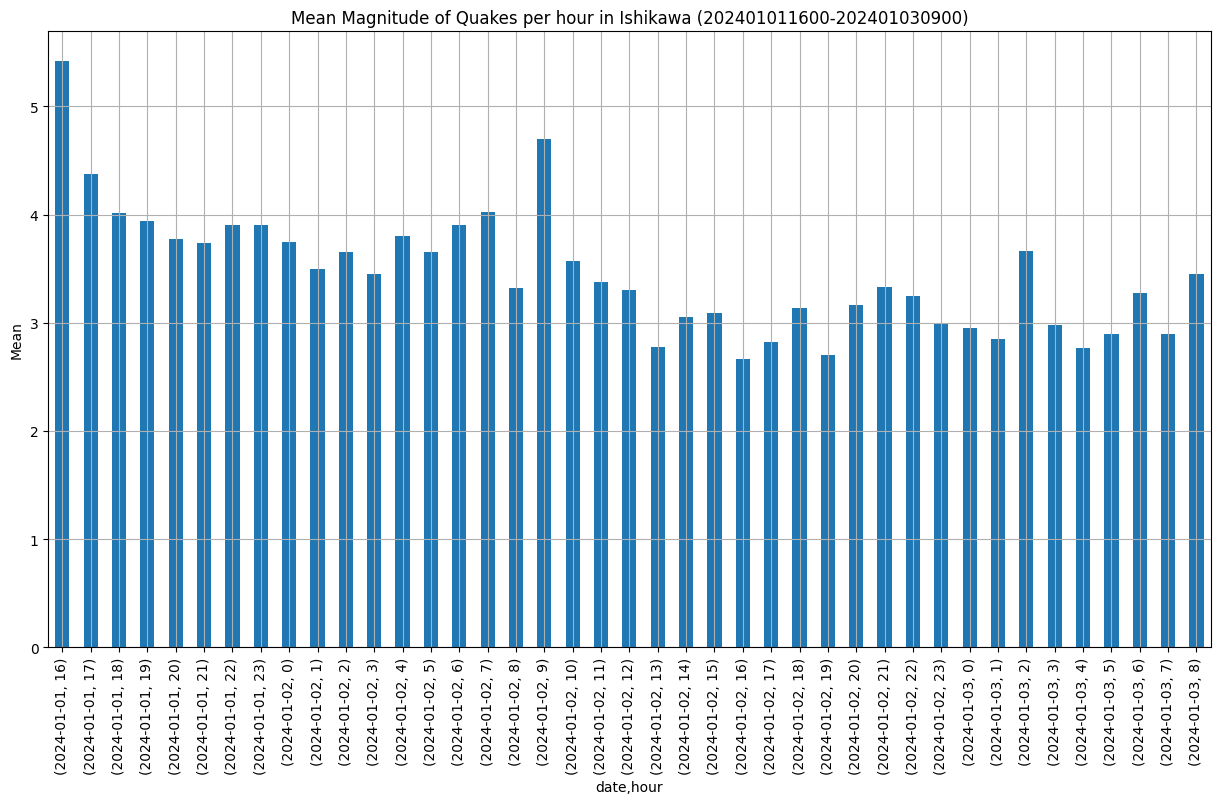
Using the same grouping idea, this time lets see the average magnitude per hour.
iquakes.groupby(["date", "hour"]).mag.mean().plot(
    kind="bar",
    title=f"Mean Magnitude of Quakes per hour in Ishikawa (202401011600-202401030900)",
    figsize=(15,8),
    grid=True,
    ylabel="Mean"
)
But, the actual intensity is important as well. This is a measurement used in Japan that gives people a good idea of how intense the earthquake was. The scale ranges from 1 to 7, 7 being the worst. But it has a few other things like 5 Lower, 5 Upper, 6 Lower, 6 Upper. So really in total there are 9 possible values.
This kind of information gives you a better idea of what kind of impact a quake may have.
The data can be grouped by the intensity and from there it’s trivial to get descriptive statistics:
intensity_index = ["1","2","3","4","5-","5+","6-","6+","7"]
iquakes.groupby("max_intensity").mag.describe().reindex(intensity_index)
|
count |
mean |
std |
min |
25% |
50% |
75% |
max |
| max_intensity |
|
|
|
|
|
|
|
|
| 1 |
56.0 |
2.837500 |
0.385917 |
1.9 |
2.575 |
2.9 |
3.025 |
3.6 |
| 2 |
59.0 |
3.359322 |
0.449566 |
2.4 |
3.100 |
3.3 |
3.700 |
4.3 |
| 3 |
44.0 |
3.822727 |
0.447662 |
2.8 |
3.575 |
3.8 |
4.200 |
4.8 |
| 4 |
17.0 |
4.547059 |
0.291800 |
4.0 |
4.400 |
4.5 |
4.700 |
5.2 |
| 5- |
2.0 |
5.100000 |
0.707107 |
4.6 |
4.850 |
5.1 |
5.350 |
5.6 |
| 5+ |
4.0 |
5.625000 |
0.457347 |
5.0 |
5.525 |
5.7 |
5.800 |
6.1 |
| 6- |
NaN |
NaN |
NaN |
NaN |
NaN |
NaN |
NaN |
NaN |
| 6+ |
NaN |
NaN |
NaN |
NaN |
NaN |
NaN |
NaN |
NaN |
| 7 |
1.0 |
7.600000 |
NaN |
7.6 |
7.600 |
7.6 |
7.600 |
7.6 |
You will notice that there is no 6- or 6+. Those intensities did occur but they were at the same time as the M7.6 quake - and this is showing the maximum intensity per quake, and for that one it was 7. In other words, there were no quakes that had a maximum intensity of 6- or 6+, at least within the last few days.
A few other interesting things to note:
- There are slightly more quakes that result in a level 2 intensity
- Quakes that could potentially result in damage (
5+ or greater intensity) are not many – 6 in total.
- There were 4 quakes that resulted in 5 Upper intensity - depending on where those occured, that could have caused further damage to already broken houses.
Probably a particularly useful and informative data point would now require loading all of the attached JSON files, flattening the data, and getting the maximum intensity for each city or station. Then it would be possible to see which cities may have been affected the worst. Those cities need aid.
That makes me wonder if agencies are using that kind of aggregated information or are strictly relying on other data like phone-ins, etc.
2024-01-02
There was a substantial earthquake (M7.6) in Noto Peninsula, Japan on January 1, 2024. JMA used to have tables to view earthquake information and this seems to now be buried in a strange place in their UI. The map views are very useful, but it’s not easy to get summary information.
It was trivial to find the source data they use – it’s a JSON file:
https://www.jma.go.jp/bosai/quake/data/list.json
It seems to contain only the information for the previous month.
There is another one that has information about long period ground movement which I didn’t really look at in-depth:
https://www.jma.go.jp/bosai/ltpgm/data/list.json
After loading the quake data into a pandas dataframe, it had a lot of extra stuff and some things that I had no idea what it meant. But after a bit more digging around I was able to figure out most of it and the parts that weren’t necessary to keep.
First: imports and some clean up.
import pandas as pd
import datetime
import matplotlib.pyplot as plt

# The json url
quakes_json_url = "https://www.jma.go.jp/bosai/quake/data/list.json"

# Load it into a dataframe
quakes = pd.read_json(quakes_json_url)

# Get rid of entries where the magnitude is unknown
mask = quakes.mag != "M不明"
quakes = quakes.loc[mask]

# Get rid of distant stuff (overseas)
mask = quakes.en_ttl != "Distant Earthquake Information"
quakes = quakes.loc[mask]

# Drop anything where ttl (Title) isn't "震源・震度情報" (Epicenter information)
# Some of the entries are more like "information" and I believe these are not necessary
mask = quakes.ttl == "震源・震度情報"
quakes = quakes.loc[mask]

# Extract the latitude, longitude and depth from 'cod' column
# We won't include the +/- for lat/long because Japan is all +
pattern = "[+-](\d{0,3}\.\d)[+-](\d{0,3}\.\d)[+-](\d*)/"
quakes[["latitude", "longitude", "depth"]] = quakes.cod.str.extract(pattern)

# Convert some columns to float/int
quakes.mag = pd.to_numeric(quakes.mag)
quakes.acd = quakes.acd.astype("int")
quakes.latitude = pd.to_numeric(quakes.latitude)
quakes.longitude = pd.to_numeric(quakes.longitude)
quakes.depth = (pd.to_numeric(quakes.depth) / 1000).astype("int") # convert to km first

# Convert 'at' to datetime but first will drop the offset
quakes["at"] = quakes["at"].apply(lambda x: x.replace("+09:00", "").replace("T", " "))
quakes["at"] = pd.to_datetime(quakes["at"])

# One other issue is that there are duplicates. I believe this is resolved by keeping the "ser" 2
# There was one row, for example, that showed the big earthquake at M7.4, and another at M7.6
# But on the website the M7.6 is what is shown
# The eid is duplicated, and the first duplicate is the "ser" 1
quakes = quakes.drop_duplicates("eid")

# Drop columns we don't need
# ctt ?, rdt (Report Date Time), ttl (Title), en_ttl (English Title), ift ?, ser (Serial), cod, int, eid (Event ID)
# 'int' is intensity information for stations, but the json file is more detailed
# 'at' is utc datetime
quakes = quakes.drop(
    ["ttl", "en_ttl", "ctt", "rdt", "ift", "cod", "int", "ser"],
    axis=1
)

# Set index to eid
quakes = quakes.set_index("eid")

# Rename columns
quakes = quakes.rename(
    columns={
        "anm": "area_name",
        "en_anm": "area_name_en",
        "maxi": "max_intensity",
        "at": "date_time",
        "acd": "area_code",
    })


quakes.head()
|
date_time |
area_name |
area_code |
mag |
max_intensity |
json |
area_name_en |
latitude |
longitude |
depth |
| eid |
|
|
|
|
|
|
|
|
|
|
| 20240102182939 |
2024-01-02 18:29:00 |
石川県能登地方 |
390 |
4.3 |
3 |
20240102183318_20240102182939_VXSE5k_1.json |
Noto, Ishikawa Prefecture |
37.5 |
137.3 |
10 |
| 20240102182547 |
2024-01-02 18:25:00 |
石川県能登地方 |
390 |
3.2 |
1 |
20240102182918_20240102182547_VXSE5k_1.json |
Noto, Ishikawa Prefecture |
37.2 |
136.7 |
10 |
| 20240102182034 |
2024-01-02 18:20:00 |
石垣島近海 |
854 |
4.4 |
1 |
20240102182339_20240102182034_VXSE5k_1.json |
Adjacent Sea of Ishigakijima Island |
24.8 |
124.3 |
70 |
| 20240102180754 |
2024-01-02 18:07:00 |
石川県能登地方 |
390 |
2.9 |
2 |
20240102181039_20240102180754_VXSE5k_1.json |
Noto, Ishikawa Prefecture |
37.2 |
136.7 |
10 |
| 20240102180701 |
2024-01-02 18:07:00 |
和歌山県北部 |
550 |
3.1 |
1 |
20240102181014_20240102180701_VXSE5k_1.json |
Northern Wakayama Prefecture |
33.9 |
135.1 |
10 |
This left us with a dataframe that has a number of nice columns:
# quakes columns
[
    'date_time',
    'area_name',
    'area_code',
    'mag',
    'max_intensity',
    'json',
    'area_name_en',
    'latitude',
    'longitude',
    'depth'
]
The code for Ishikawa-ken is 390 - it’s fairly easy to determine that by looking at the data. There have been around 24 hours that have passed since the M7.6 earthquake. How many aftershocks have been in the area?
# Number of quakes in 390 in a 24 hour time frame

# First, specify some dates/times
# 4pm, new years
start = datetime.datetime.fromisoformat("2024-01-01 16:00")
# 24hrs later
end = datetime.datetime.fromisoformat("2024-01-02 16:00")

# Make a date/time mask
dt_mask = (quakes.date_time > start) & (quakes.date_time < end)

# Make a location mask for Ishikawa prefecture
location_mask = quakes.area_code == 390

# Apply the mask and see how many there are
quakes[location_mask & dt_mask].shape[0]
116 quakes in 24 hours. That’s a lot of quakes… one every 12 minutes or so. Well, really there were 115 because there was an M5+ at around 4:06pm.
Plotting the magnitude
ishikawa_quakes = quakes[location_mask & dt_mask]

# sort in reverse, and reset the index
ishikawa_quakes = ishikawa_quakes.sort_values("date_time", ascending=True).reset_index().drop("eid", axis=1)

# plot it
ishikawa_quakes.mag.plot(
    title="Quake Magnitude, Ishikawa",
    xlabel="Date/Time",
    ylabel="Magnitude",
    figsize=(30,10),
    kind="bar",
)
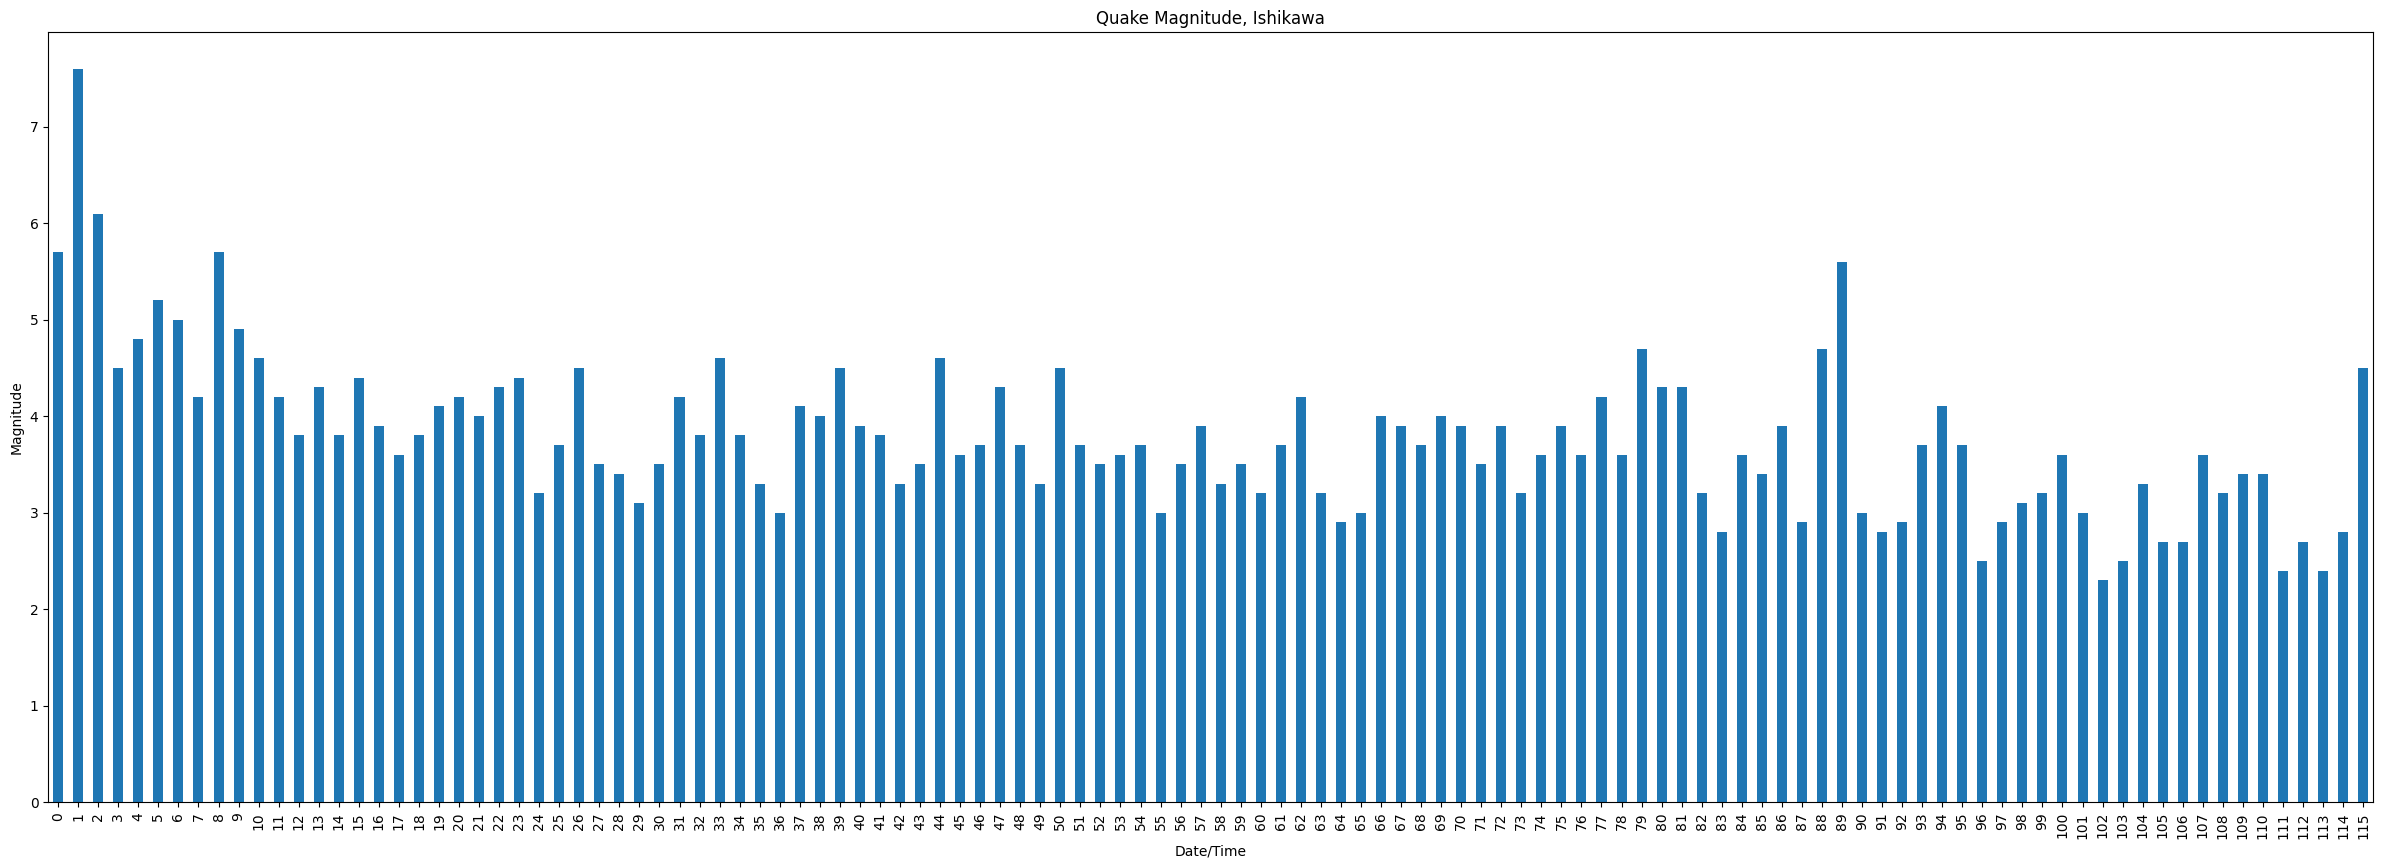
It’s important to consider the depth of the earthquakes as well, but I was mostly curious to just plot the magnitude and see how many quakes there were.
More details…
The json column is interesting. Each json file contains a complete listing of each intensity station affected by the listed earthquake. It also has the names for prefectures, areas, cities, and the station. Station data has the intensity and geolocation. If you really wanted to dig in, you could create another dataframe with this data flattened, do a merge, and then you could see what earthquakes affected a station near you.
There’s also a lot of information to go through just in the dataframe from above. The JMA website has a seismic acitivty map (circles and size on locations). I believe it uses depth to color the circles and the diameter is determined by the magnitude. It could be interesting to plot these to a map with GeoPandas. In combination with the data from the json column, the “most recent” earthquake could easily be displayed with the intensity recorded by affected stations.
2023-12-31
Test.
Nothing to see here, move along.